





Personal Budget Template
A budget for one: your take-home pay at the top, four groups of categories below, and \u2014 the column the family sheets don't have \u2014 each group's share of your pay, computed live. Housing creeping past a third of take-home, savings quietly shrinking toward zero: the % column surfaces both while the month is still fixable. Excel and Sheets do the math; the PDF does the fridge.
One sheet, every format.
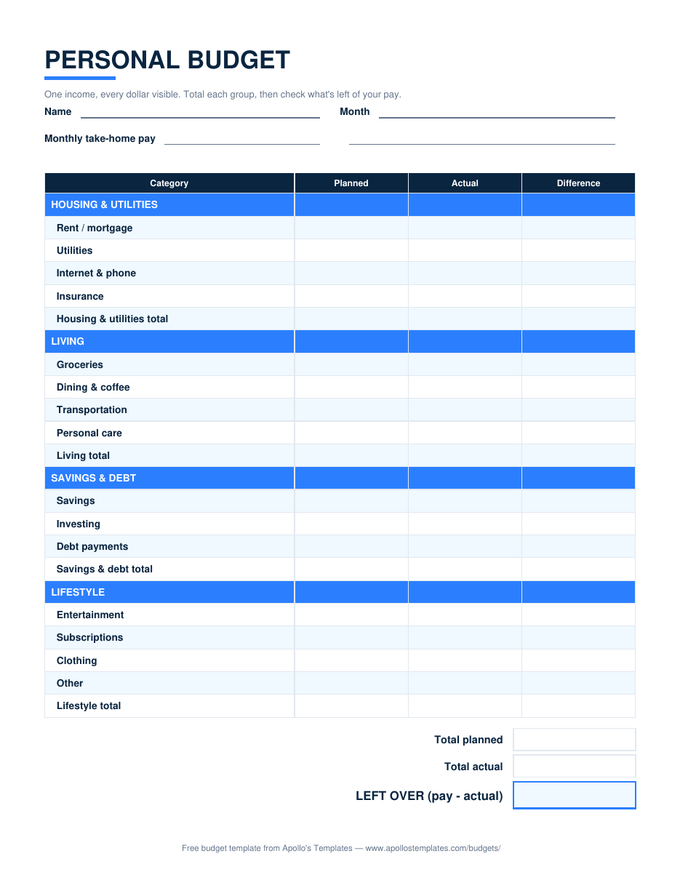
The percentages are the early-warning system.
Dollar amounts drift quietly — a rent increase here, a subscription there — and each one passes the “it’s only...” test individually. Shares of income don’t pass so easily. Housing at 30% of pay is a common comfort line; watching it cross 35% after a lease renewal is the kind of fact that changes apartment-hunting timelines. The % column exists to make drift look like drift.
The benchmark worth keeping in view: the 50/30/20 shape — half of pay to needs, thirty to wants, twenty to savings and debt. Your groups won’t map onto it perfectly (that’s fine; this sheet is category-first, not rule-first), but if Savings & Debt reads 4% three months running, no amount of category shuffling is the real problem. For the rule-first version, the 50/30/20 sheet runs the buckets natively.