



Apollo's Templates
HomeBudget TemplatesRestaurant
Managed to prime cost

Restaurant Budget Template

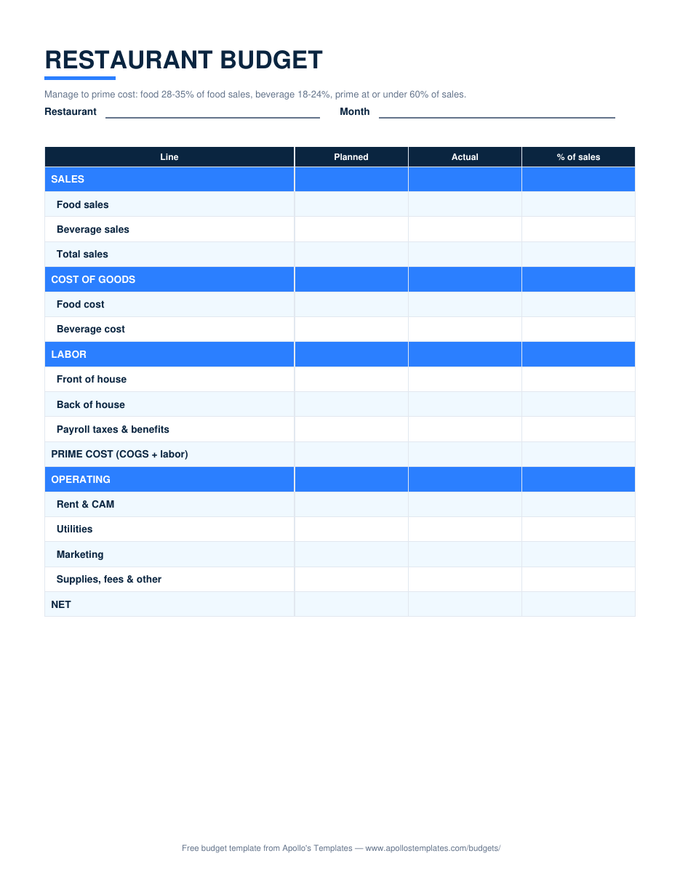
Restaurants live and die by one number the rest of the business world barely uses: prime cost \u2014 food and beverage cost plus all labor, as a share of sales. This sheet is built around it: sales split food and beverage, cost percentages computing against their own sales lines (food cost against food sales, the way operators actually track it), labor split front and back of house, and the prime cost line landing where you can't not see it. At or under 60% of sales is the line between a restaurant and an expensive hobby.

The operator's sheet

One sheet, every format.

Excel — percentages computed

Food and beverage cost percentages against their own sales lines, prime cost with its share of sales, and NET at the bottom.
Restaurant budget with sales, cost of goods, labor, and a prime cost line against sales
PDF

Printable PDF

The operator's sheet on paper — the weekly numbers meeting version.
Download PDF

Word / Google Docs

The layout as an editable document for the business plan's financials section.
Worth knowing

Prime cost is a weekly number, not a monthly one.

The operators who stay open treat prime cost as a weekly vital sign, not a month-end discovery. Food cost drifts in small increments — a supplier price bump here, portion creep there, a prep cook’s generous hand — and labor drifts in scheduling decisions made shift by shift. Caught weekly, each drift is a correction; discovered monthly, it’s a bad month; discovered quarterly, it’s a lease you can’t exit. Run this sheet monthly for the budget, but pull the prime-cost math weekly from your POS even if it’s scribbled on a prep list.

The percentage benchmarks earn their keep as diagnosis: food cost at 28-35% of food sales, beverage at 18-24%, prime at or under 60%. When prime runs hot, the split tells you which lever — food cost high means menu pricing, portioning, waste, or supplier problems; labor high means scheduling against slow shifts or a menu too complex for the line. Occupancy past 10% of sales is the one problem this sheet can only report, not fix; that conversation is with the landlord or the volume.

The generic twin
Business Budget
The 12-month grid for the restaurant's full year planning.
Open
Staff the line
Restaurant-Ready Timesheets
Weekly timesheets with overtime math for the crew behind the labor line.
Open
Count the drawer
Petty Cash Log
The cash-box ledger for the register bank and small buys.
Open

Frequently asked questions

Why does food cost compute against food sales instead of total sales?
Because blended percentages hide problems. A bar-heavy month lowers your food cost as a share of total sales without the kitchen improving at all — beverage's fat margins are doing the flattering. Computing each cost against its own sales line (food/food, beverage/beverage) is the industry-standard discipline this sheet enforces, and it's what makes the numbers comparable across months with different sales mixes. The prime cost line then blends them back deliberately, at the one level where blending is the point.
What should prime cost actually be?
The working ceiling is 60% of sales, with well-run full-service spots landing 55-60% and quick-service sometimes better. But treat it with the occupancy caveat: a restaurant paying 6% of sales in rent can carry a 62% prime cost; one paying 12% cannot. The real target is prime plus occupancy under about 70%, leaving room for everything else and a profit. If your prime is at 65% and dropping it feels impossible, the menu is usually the honest suspect — pricing, mix, or complexity.
How do I budget labor between front and back of house?
Start from your service model's gravity: full-service runs roughly even between FOH and BOH; counter service and cafes run BOH-heavy. The split's value is diagnostic — when labor runs hot, knowing which side tells you whether the fix is floor scheduling (too many servers on slow Tuesdays) or kitchen structure (prep hours, a menu needing more hands than the volume funds). Payroll taxes and benefits get their own line here because they're real labor cost that per-shift thinking always forgets — typically adding 10-15% on top of wages.
Does this work for a food truck or cafe?
The bones fit anything that sells food: sales, COGS percentages, labor, prime cost. A truck simplifies some lines (occupancy becomes commissary fees, permits, and fuel — relabel the operating rows) and a cafe often needs beverage split further (coffee program vs everything else, since coffee margins carry the model). The prime-cost discipline transfers exactly; if anything it matters more at small scale, where a five-point drift is the month's entire profit.
Updated through August 2026