




Apollo's Templates
HomeBusinessExpense Report TemplatesQuarterly
Three months on one page

Quarterly Expense Report Template

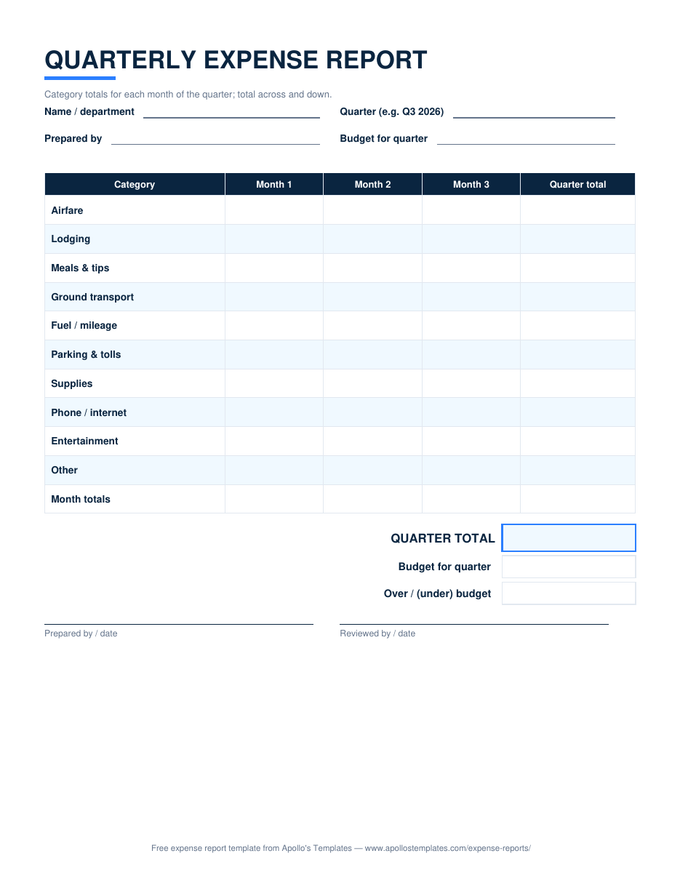
The summary that boards, owners, and department heads actually read: ten expense categories down the side, the quarter's three months across, totals in both directions, and a line that compares the quarter to its budget. You type each month's category totals \u2014 straight from the monthly expense reports \u2014 and the quarter computes itself. Print it as a PDF for the meeting; keep the Excel for the trend.

Three formats

The quarter, three ways.

Excel — totals both directions

Ten categories by three months; row and column totals, the quarter total, and over/under against a budget figure compute as you type.
Quarterly expense report with expense categories down the side, three month columns across, and quarter totals both ways against a budget
PDF

Printable PDF — the meeting handout

The one-page quarterly summary to print for a board packet or department review.
Download PDF

Word (.docx)

Editable for reports that get pasted into a memo or narrative — type the month totals into the table.
Worth knowing

The quarter is where trends become visible.

Monthly numbers wobble — a conference, a slow month, a vendor’s timing. Quarters smooth that out enough to show the truth: entertainment creeping up three quarters running, phone costs that never came down after the plan change, supplies that track headcount. This page exists to put that trend in front of someone who can act on it, on a single sheet they’ll actually read.

Present the same ten categories every quarter, in the same order. Consistency is what makes a stack of quarterly reports a story instead of a pile — and it’s why this template refuses to let the categories drift from the monthly sheets that feed it.

Twelve months, one grid
Annual Expense Summary
Month columns by category with quarter and year totals.
Open
Where each month's numbers live
Monthly Expense Report
Thirty-one dated rows and the category summary that feeds this sheet.
Open
Plan the next quarter
Business Budget Template
Quarterly revenue and expense grid with net rows.
Open

Frequently asked questions

Where do the month numbers come from?
From the monthly expense reports' category summaries — that's why both sheets use the same ten categories. Each month's SUMIF block produces exactly the column this sheet wants. If you run the expense tracker instead, its monthly summary supplies the same figures by category.
Is this a quarterly report for taxes or for management?
Management — it's the “how did we spend this quarter” page for owners, boards, and department reviews, and the quarterly view that estimated-tax payments are planned against. For the IRS itself, the year-end summary and the individual reports with receipts are the records; this sheet is the readable layer on top of them.
How should I use the budget line?
Enter the quarter's expense budget in the header and the sheet shows over/(under) at the bottom — a positive number means overspent. Reviewers ask that question first; having it computed keeps the meeting on why rather than on arithmetic. Leave the budget blank and the lines simply stay empty.
Can I compare quarters?
Keep one file per quarter and the year lines up as four columns of quarter totals — or paste each quarter's total column into the annual expense summary, whose twelve month columns and quarter subtotals are built for exactly that view.
Updated through September 2026