Apollo's Templates
HomeBusinessExpense Report TemplatesAnnual
Twelve months, one page

Annual Expense Report Template

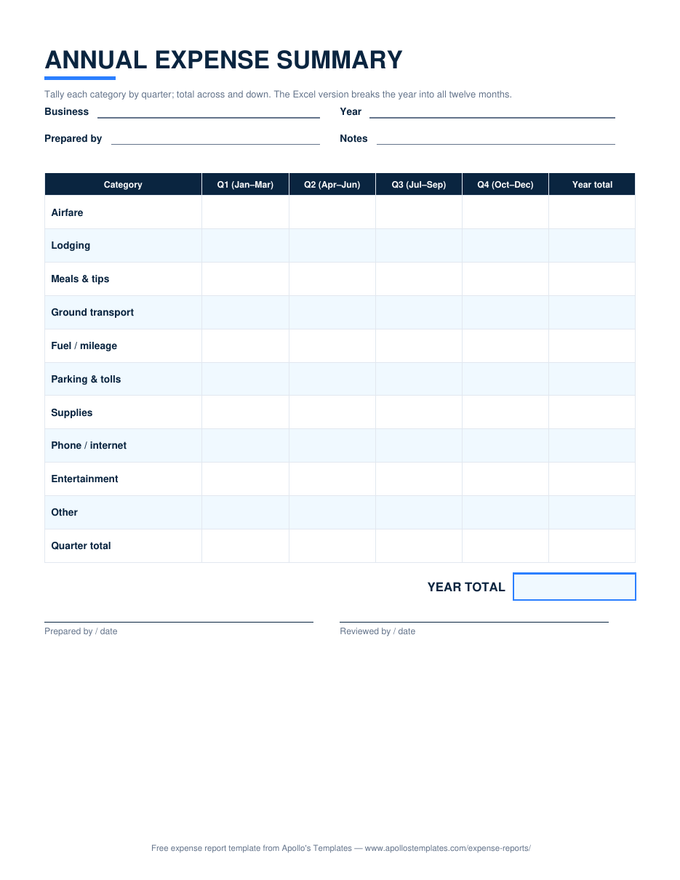
The year-end view: every expense category down the side, every month across the top, with row totals, column totals, quarter subtotals, and the year figure all computing themselves in the Excel version. Fill it from twelve monthly reports — or from the statements, if this is the year you start — and the result is the one page that shows what the year actually cost, and where.

Three formats

The year grid, monthly or quarterly.

Worth knowing

Fill it in January, thank yourself in April.

The gap between businesses that dread tax season and businesses that don’t is rarely the accountant — it’s whether the year’s numbers exist in one place before anyone asks for them. Transferring each month’s category summary into this grid takes about five minutes on the first of the month. Reconstructing the same twelve numbers from statements the following April takes a weekend, and the weekend version always misses things.

One deliberate omission: there’s no income side on this sheet. It’s an expense summary, not a profit-and-loss — mixing the two invites double-keeping books you already keep elsewhere. If what you actually need is a P&L, your accounting software’s report is the right tool; this grid is for seeing the spending.

The monthly feeder
Monthly Expense Report
Its category summary produces exactly the ten numbers each month-column here wants.
Open
The year's driving
Mileage Log
Year-end mileage totals land in the Fuel / mileage row at the IRS standard rate.
Open
Zero installs
Google Sheets Expense Templates
The year grid as a make-a-copy Sheet — share it with your preparer as a link.
Browse

Frequently asked questions

Where do the monthly numbers come from?
Ideally from twelve monthly expense reports — the monthly sheet's category summary produces exactly the ten numbers each of this grid's columns wants, so year-end becomes transcription rather than archaeology. If you didn't keep monthly sheets, the fallback is your bank and card statements: work month by month, categorize as you go, and accept that the first year is the slow one. Either way, this grid is the destination, not the source — it summarizes records, it doesn't replace them.
Why is the PDF version quarterly when the Excel version is monthly?
Because the two formats serve different hands. In a spreadsheet, twelve columns cost nothing — the formulas total them and a landscape page prints them fine. On paper, 120 write-in cells produce cramped handwriting and arithmetic errors, so the printable tallies the same ten categories in four quarterly columns instead. Same categories, same year total, different granularity. If you want monthly-on-paper anyway, print the Excel version — it's laid out for landscape US Letter.
Can I use this for tax preparation?
It's a strong head start, with a caveat. The grid's category totals map readily onto the expense lines a tax return asks for, and handing your preparer one organized page beats handing them a shoebox. But tax categories aren't identical to management categories — meals carry a 50% deduction limit, entertainment is largely nondeductible on US federal returns, and mileage has its own computation. Keep the receipts behind the numbers, and let the preparer apply the tax treatment; describe, don't self-deduct blind.
What should I look for once the grid is filled in?
Two patterns pay for the exercise. First, trend: read each category row across the year — a cost that doubled quietly, month by month, is invisible in any single report and obvious here. Second, seasonality: the quarter totals show whether spending clusters (Q4 conference season, summer travel), which is what makes next year's budget realistic instead of aspirational. The grid is less an accounting document than the once-a-year chance to see the shape of the spending.
Updated through August 2026